Spencer Platt/Getty Images News
The consensus narrative among economists and market analysts around the fate of growth in the greater economy over the near term continues to bounce pell-mell from one extreme to the other—and back again—with uncanny regularity. Confused?
What About the Yield Curve?
Figure 1: Ten/Two Year Yield Curve Spread
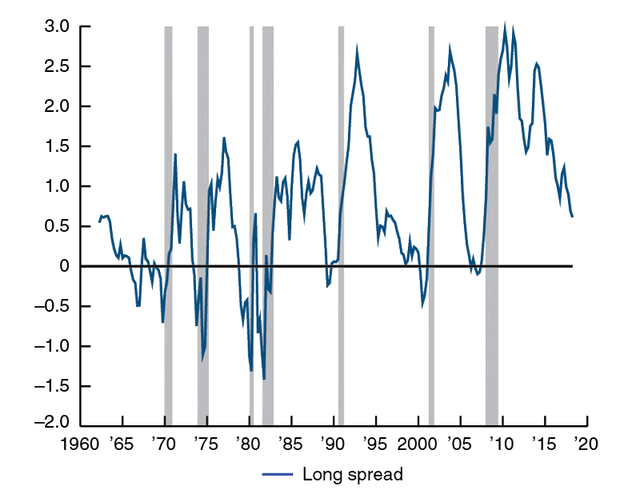
10-year/2-year Spread (Federal Reserve Bank of Chicago)
The 10-year/2-year spread went negative in the first week of April 2022 and has largely remained so since July of last year. Figure 1, above, sketches out all of the US recessions since 1970. While the lapse of time and severity of yield curve inversions differ with each example, the inversions, indeed, preceded each of the US recessionary periods. While an inverted yield curve appears tied to recessions, it is important to remember that an inverted yield curve is less a forecasting tool for a recession than an indicator of future economic activity, not least of which the ability of both companies and government to meet existing and future debt obligations over time. Nor is the volatility of bond yields in the greater economy a singular portent of recession. In the last month alone, the highly interest rate sensitive 2-year treasury note posted a YTD high of 5.05% on March 8 and a YTD low of 3.76% on March 24—in a two-week span. Recessions occur as a result of myriad factors impacting the greater economy, including current monetary and fiscal initiatives, price inflation, supply chain bottlenecks, job creation, wage growth, consumer spending, discretionary income, consumer confidence—in short, the overall health of the economy determines the breadth, scope, and occurrence of a recession.
What About Economic Growth?
Last Thursday’s initial GDP report on growth in the first quarter came in at 1.1%, according to the Commerce Department—a significant downshift from 2.6% and 3.2% QOQ growth of the fourth and third quarters, respectively. Interest rate sensitive gross domestic investment fell 12.5% during the quarter, led by an eight-month downside drag by the housing sector as the continuing squeeze of monetary policy further defines investment activity in the greater economy. Existing home sales dropped 2.4% in March and 22% YOY with the median price of an existing home selling for supply-tinged high of $375,700 on an inventory of a scarce 2.6 months. Further financial pain is about to hit home in the commercial real estate space with an estimated $1.5 trillion in debt refinancing coming due through 2025.
Consumer spending—about 70% of US economic activity—remained outwardly robust, advancing 3.7% QOQ. It was the strongest showing for consumer spending since the upside, pandemic-induced blowout logged in Q2 of 2021. Buoyed by disposable income rising by 12.5% QOQ, consumers appear to still be drawing on generous government outlays of the 2019 Covid-19 pandemic. Adding to the direct, if dwindling, impact from the fiscal largess of the pandemic period, total compensation for workers in both the private and public sectors rose 4.5% through the end of March YOY with wages and salaries rising 4.7% for the period. Together, final sales to domestic private purchasers soared 7.3% QOQ for the biggest percentage QOQ gain since Q2 of 2022. Surprisingly, automobiles remained a hot, if questionably affordable, item of pent-up demand. Automobile purchases logged the biggest percentage QOQ gain since Q1 2021 despite the average new car sticker price hovering around a record-breaking high of $50,000. There was little price relief to be found on the used car lot—the average used car price also tipped the scales to the upside at $33,582 nationally through December. Of course, auto sales fell dramatically by the second quarter 2022 due to supply chain bottlenecks created by supply and demand disparities coupled with the shortage of semiconductors to power both dashboard wizardry and powertrains, a result of the chip supply distortions that de-emphasized low-end automobile chips in favor of high-end video games and streaming applications sought by consumers stuck under stay-at-home mandates during the pandemic months. The lack of semiconductors forced automakers to prioritize high end offerings at the expense of more moderately priced carlines, creating the upward price thrust of stickers in both the new and used car markets since 2021 (see Figure 2, below).
Figure 2: Average Price of New Automobiles
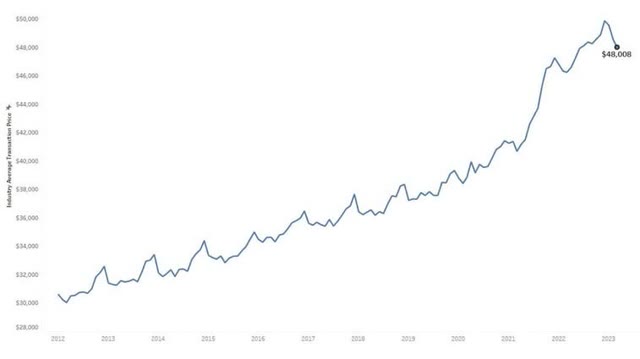
Average New Car Price through March 2023 (Kelley Blue Book)
Meanwhile, spending on household services like travel, restaurants, overnight accommodations, and financial services remain surprisingly elevated.
What About Inflation?
Figure 3: Personal Consumption Expenditures against Average Hourly YOY Wage Growth
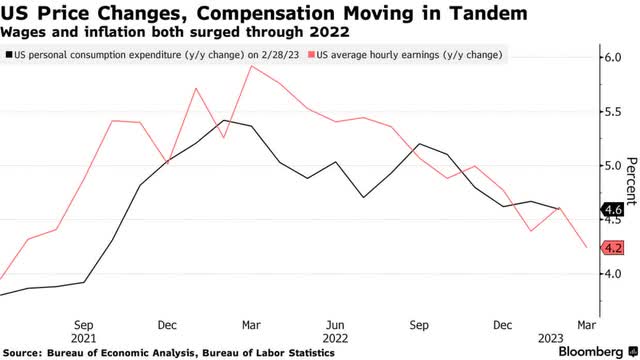
Personal Consumption Expenditures against Average Hourly YOY Wage Growth (Bureau of Labor Statistics)
Prices and overall compensation appear to be moving in relative tandem in the greater economy. Core prices for final demand goods edged up 0.1% in March, down from a 0.2% rise in February. Year over year, the rise was 3.6%, down significantly from the 18% post of June 2022. The consumer price index for all items fell 0.1% during the month, down from 0.4% in February. Year over year, the CPI for all items fell to 5% for the lowest YOY post since May of 2021. All items less energy and food rose to 5.6% YOY with the energy index falling to 6.4% while the food index rising to 8.5% YOY. The personal consumption expenditure index, the Fed’s favored inflation measure, fell to 0.1% in March, down from 0.4% MOM. Year over year, the PCE fell to 4.2%, down from 5.1% in February. The YOY rise in final demand goods, CPI and PCE are inflation measures that are still well above the Fed’s 2% inflation target--but clearly headed in the right direction.
What About the Labor Market?
As we have seen, wages are up 4.7% through the end of March providing much of the momentum for the continued robust spending level emerging from the Commerce Department’s first of three iterations on economic growth in the first three months of the year. It is worth mentioning that wages are not a leading indicator of prices in the greater economy. On the contrary, wages mostly lag price increases. That said, the unemployment rate stood fast and tight at 3.5% through the end of March, a distant cry from the 14.7% peak of April 2020 when job losses reached 20,514 during the month. And since 1970, there has never been a recognized recession in the US with an unemployment rate at 3.5%. Since January of 2021, the economy has produced an average of 485,000 per month. March fell below the average with 236,000 jobs created in preliminary figures. Through the end of February, there were 5.9 million unemployed workers and 9.9 million jobs producing a 0.6 unemployed to jobs ratio (see Figure 4, below).
Figure 4: Number of Unemployed Per Job Opening
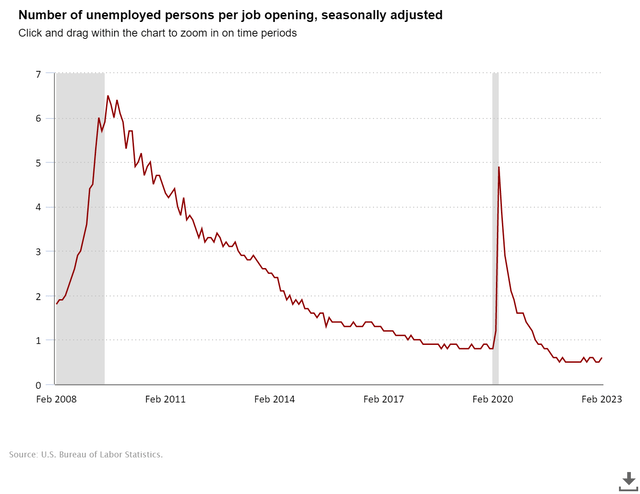
The Number of Unemployed per Job Opening (Bureau of Labor Statistics)
Where Do We Go from Here?
Markets have long priced in the expected 25-basis point rise in the federal funds rate at the conclusion of this week’s meeting of the Federal Open Market Committee. The anticipated increase will put the federal funds rate in a range of 500-to 525 basis points. By December’s FOMC meeting, markets predict with 95.2% probability that the federal funds rate remains within May’s 500-to 525-basis point range. A full 94.1% of bets place the federal funds rate between 400- and 524-basis points by year’s end. The FOMC maintains a full-throated assertion that such a drop in interest rates will not happen in 2023 (see Figure 5, below). Either the market or the Fed blinks.
Figure 5: The FOMC March Dot Plot
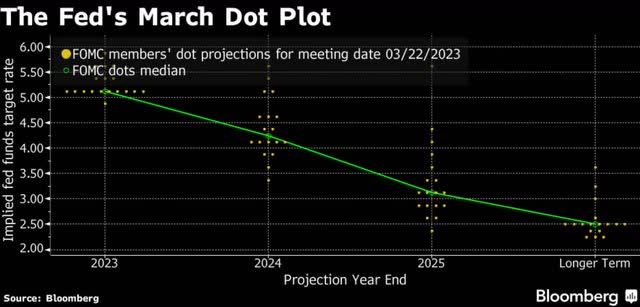
The FOMC's March Dot Plot (Bloomberg)
The contradictions continue. Consumer spending remains strong, yet businesses failed to see the need to restock inventories, which fell 2.36% in the first three months of the year. This was the biggest decline in inventories since Q1 of 2021. Consumer confidence measures came in lukewarm for the month. Emergency Fed lending to banks ticked up for the month with two banks taken over by regulators, leaving a third bank hanging by its fingernails as an ongoing lending institution (Editor's note: First Republic was since taken over by JPMorgan).
The market is clearly betting on consumer spending to carry economic growth forward. The Nasdaq posted gains exceeding 17% for the quarter; the S&P 500 gained 7.45% for the period. The Fed has price inflation under control, according to the market. What the market worries about is economic growth and continued Fed tightening that will further squeeze growth out of the market for the balance of the year and beyond. Market participants have clearly bid up a swath of traditional growth issues in the broader market—and will continue to do so if the Federal Reserve pulls back on its tightening of the federal funds rate and pushes forward its quantitative easing program now sketched in for 2024 and beyond (see Figure 5, above). The market clearly thinks forward economic growth hangs in the balance. No landing at all is the market’s path of choice.
The Link LonkMay 02, 2023 at 08:33PM
https://news.google.com/rss/articles/CBMiR2h0dHBzOi8vc2Vla2luZ2FscGhhLmNvbS9hcnRpY2xlLzQ1OTg4MDMtc29mdC1oYXJkLW9yLW5vLWxhbmRpbmctYXQtYWxs0gEA?oc=5
Soft-, Hard-, Or No-Landing At All - Seeking Alpha
https://news.google.com/search?q=hard&hl=en-US&gl=US&ceid=US:en
No comments:
Post a Comment